
In any other year, this week of September 27 to October 3 would likely have been a buyer’s market, or the “best time to buy a home” — the one week in the year when the balance of housing market conditions favored buyers the most. Instead, due to COVID-19’s impact, homebuyers in 2020 are in the middle of the most competitive and challenging housing market in recent memory.
By the end of September each year, homebuyers should be expecting the market to cool down as children go back to school and families bow out of the housing market. Specifically, this time of the season is typically characterized by trends such as lower competition from other buyers, plentiful supply of homes for sale, below-peak prices, and an approachable market pace.
However, in 2020, supply is drastically low, as sellers never quite came back to the market post-COVID, all while the appetite from buyers reached a fever pitch and stayed there. The pool of prospective buyers swelled from the time lost during lockdown as well as attractive, historically low mortgage rates. Sellers, on the other hand, did not rush back into the market, leading to a lopsided buyer-seller dynamic. Without homes for sale, everyone faced mounting competition.
Here are some of the key housing metrics that are bucking historical trends during what would normally be the “best time to buy.”
Active Inventory (Number of Homes For Sale)
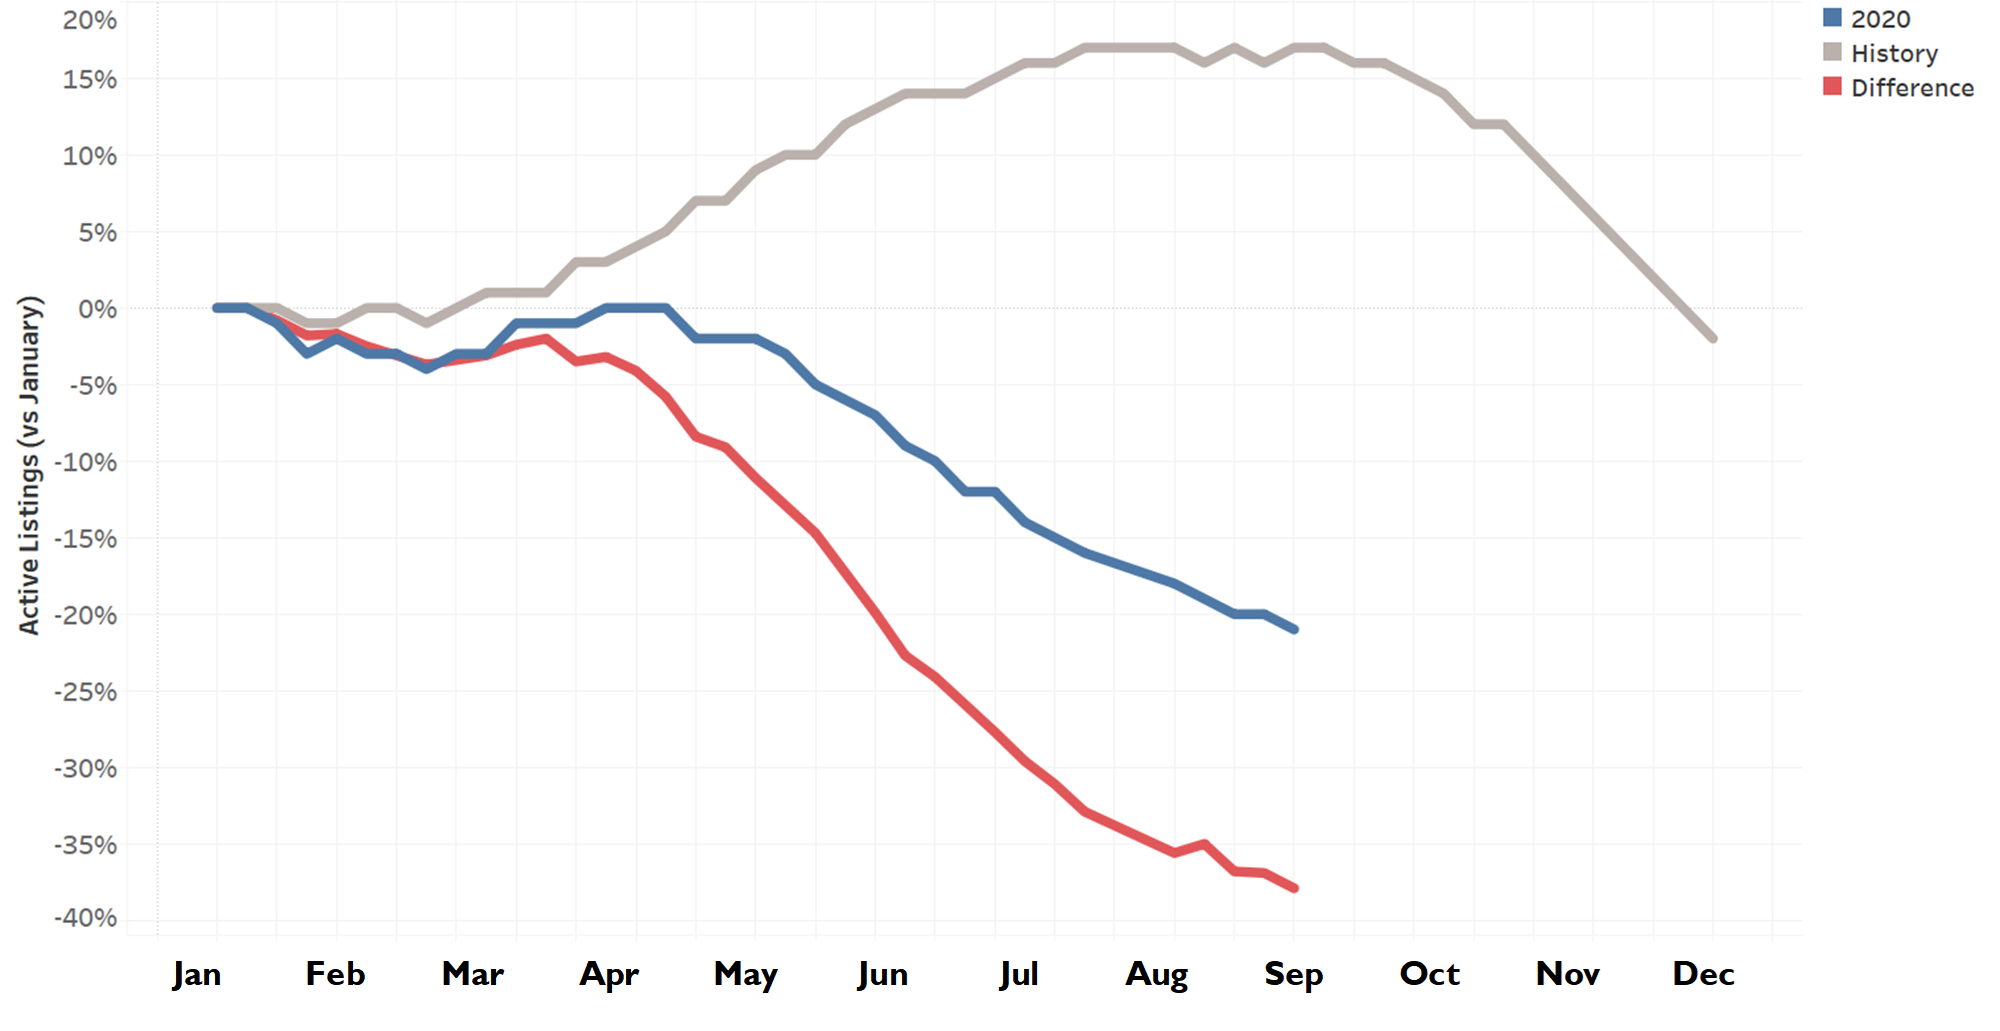
What we expected: In the first week of fall, the number of homes for sale should be peaking as new listings continue entering the market, and unsold homes linger on the market before the season ends in earnest. There should be 17 percent more listings compared to the start of the year.
What we got: Active inventory is down 21 percent compared to the start of the year and shows no sign of slowing down. That equates to roughly 400,000 fewer homes on the market than expected in September.
The number of homes on the market typically peaks between August and September, as hopeful sellers remain in the market. By mid-September, there are usually 17 percent more listings on the market compared to the start of the year. In 2020, we started the year with 1.04 million listings; if the market followed the historical trend, there would now be 1.22 million listings. Instead, at 824,000 active listings, counts are 21 percent below the start-of-year baseline, equating to roughly 400,000 fewer homes on the market than expected.
Active Listings vs January
Days on Market
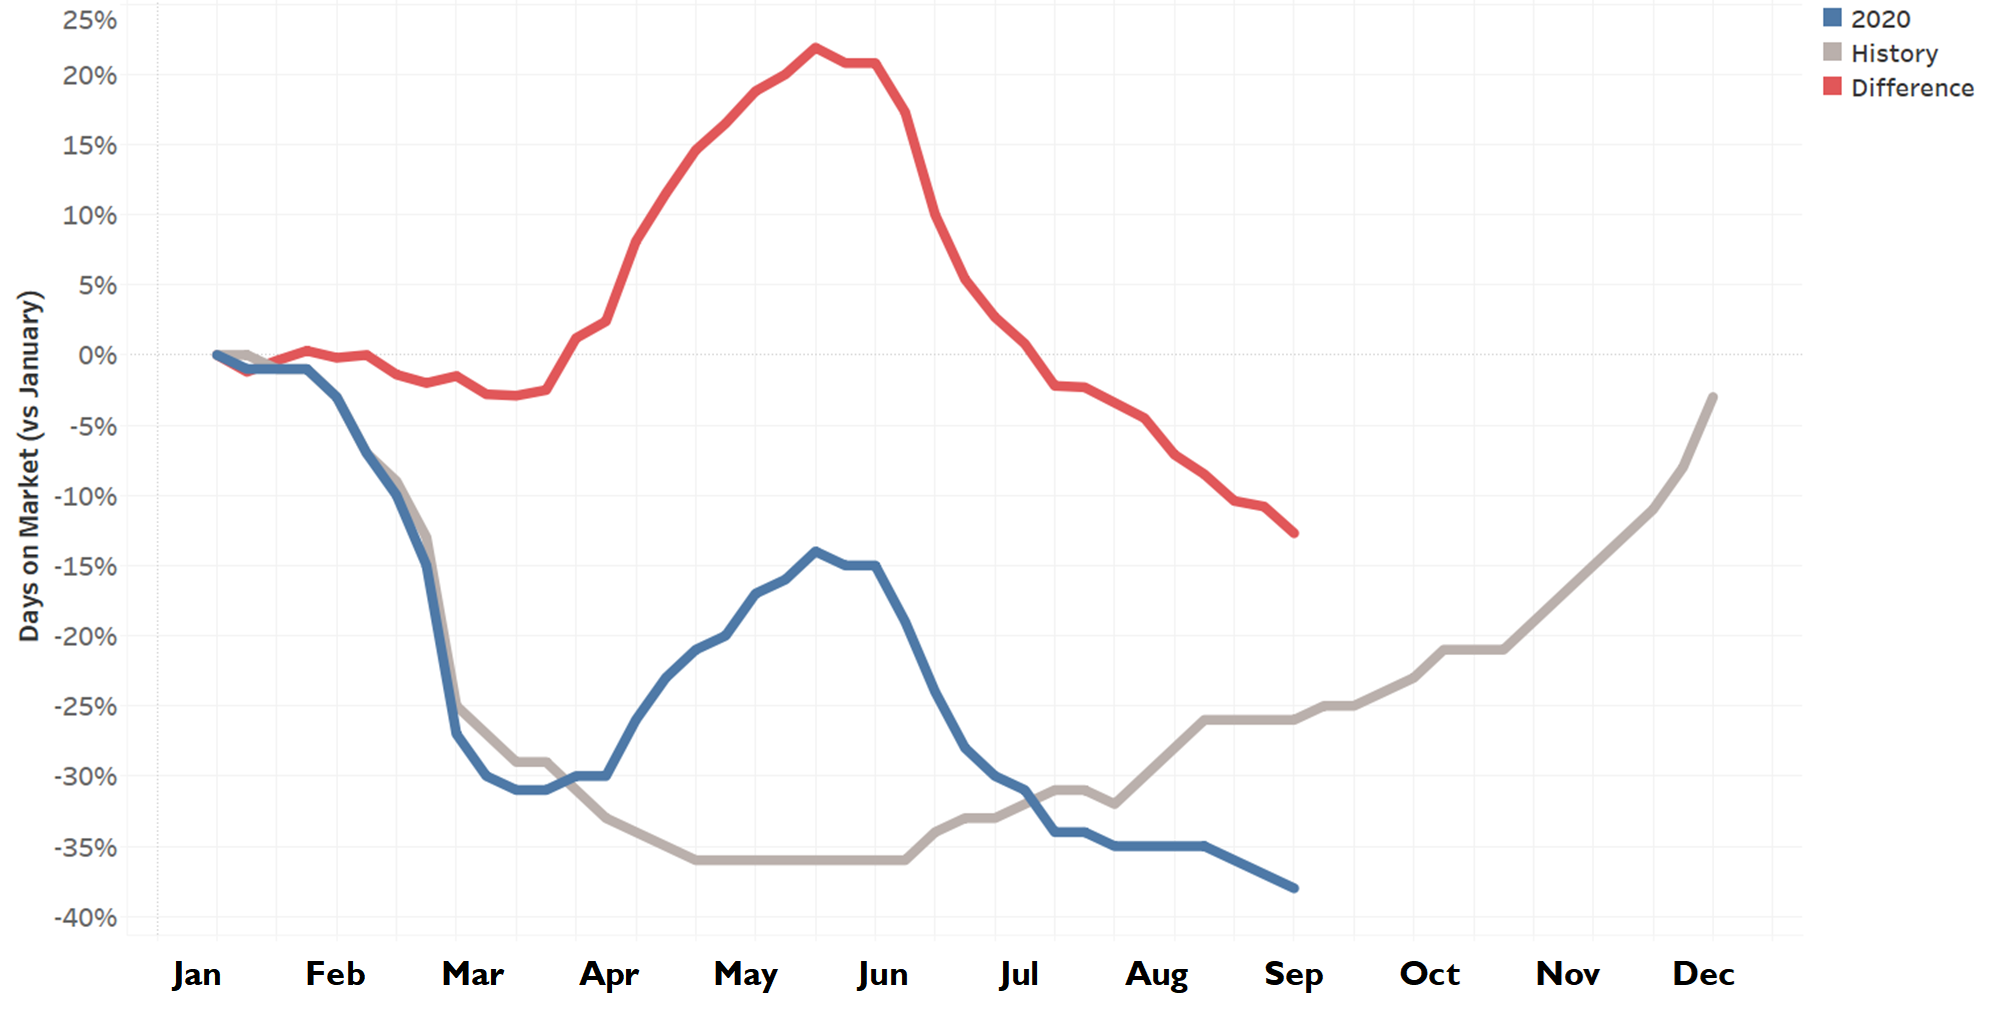
What we expected: The pace of the market should be slowing down right about now after the faster pace of spring and summer.
What we got: When COVID froze real estate activity in March, the housing market slowed substantially. Then the pace recovered and now homes are selling the fastest they have all year. This translates to homes selling 12 days faster than expected.
The pace of the market in 2020 was in lockstep with historical trends until March. The months of May and June historically mark the lowest days on market of the season, with homes selling 36 percent faster than the start of the year. Once COVID-19 hit and the US government declared a state of emergency in March, the housing market slowed dramatically, and remained slower than usual in May and June. By August, the trend had recovered to pre-COVID levels and accelerated further to a blistering pace.
In 2020, we started the year with a median days on market figure of 86 days; if the market followed the historical trend, the days on market figure in September would have been 65 days. Instead, at 53 days, the days on market figure is 38 percent below the start-of-year baseline, and homes are selling 12 days faster than expected, on average.
Median Days on Market vs January
Listing Price
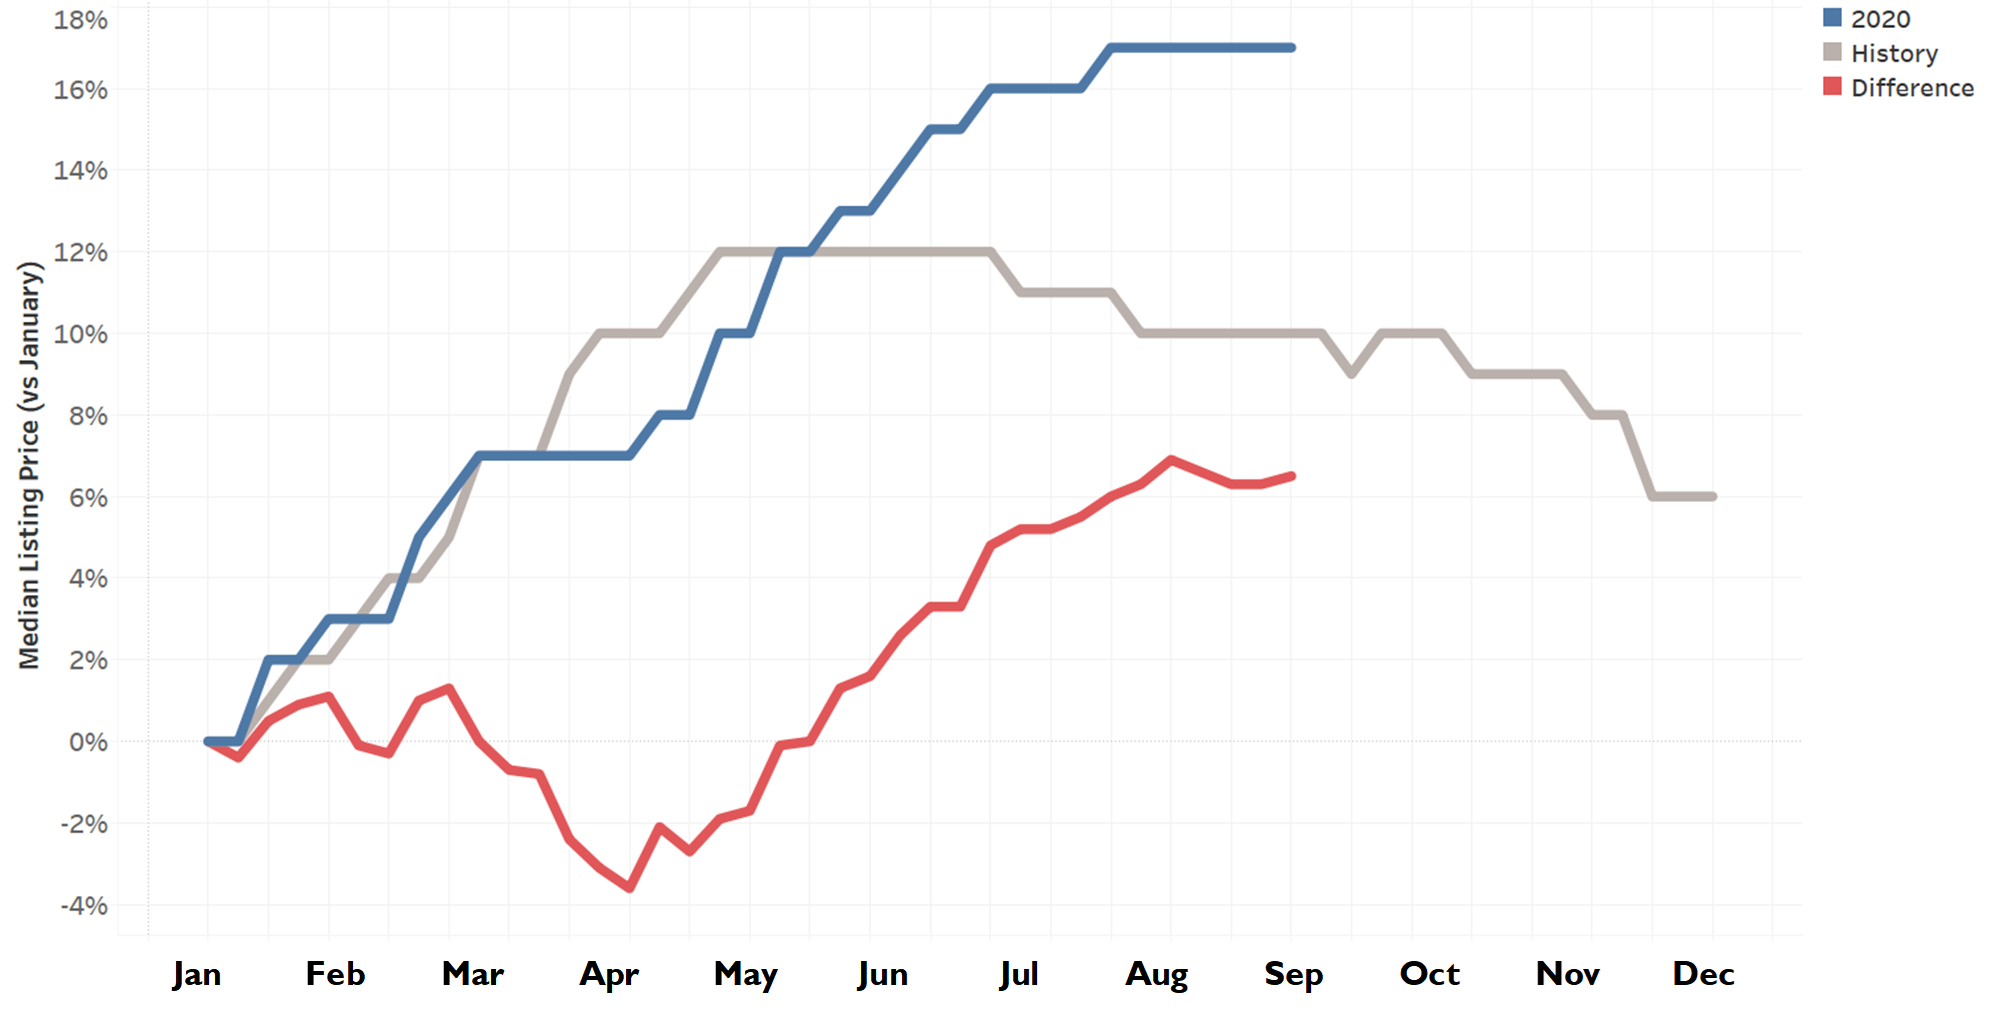
What we expected: In the first week of fall, home listing prices historically have been 10 percent greater than the start of the year, but 1.4 percent less than summer’s peak price.
What we got: In 2020, listing prices were 17 percent greater than the start of the year. This translates to a median listing price of $350,000, $20,000 greater than expected, and still on par with the year’s peak price level even in September.
Historically, listing prices rise early in the year, reaching a high point in May and flattening out through June, before easing down for the rest of the year. In 2020, listing prices rose in line with the historical trend, but then plateaued temporarily in March in response to COVID-19. By June, the price trend recovered to the historical levels, and then surpassed expectations.
By the end of September, home listing prices should have started easing, but instead now sit at their highest level for the year and may keep rising. Listing prices at this time should be 10 percent higher than the start of the year; in 2020, prices in September are 17 percent higher than the start of the year.
In 2020, we started the year with a median listing price of $300,000; if the market followed the historical trend, the median listing price would be $330,000. Instead, at $350,000, homes are selling for $20,000 more than expected.
Median Listing Price vs January
Homebuyer Demand (Unique Visitors on realtor.com)
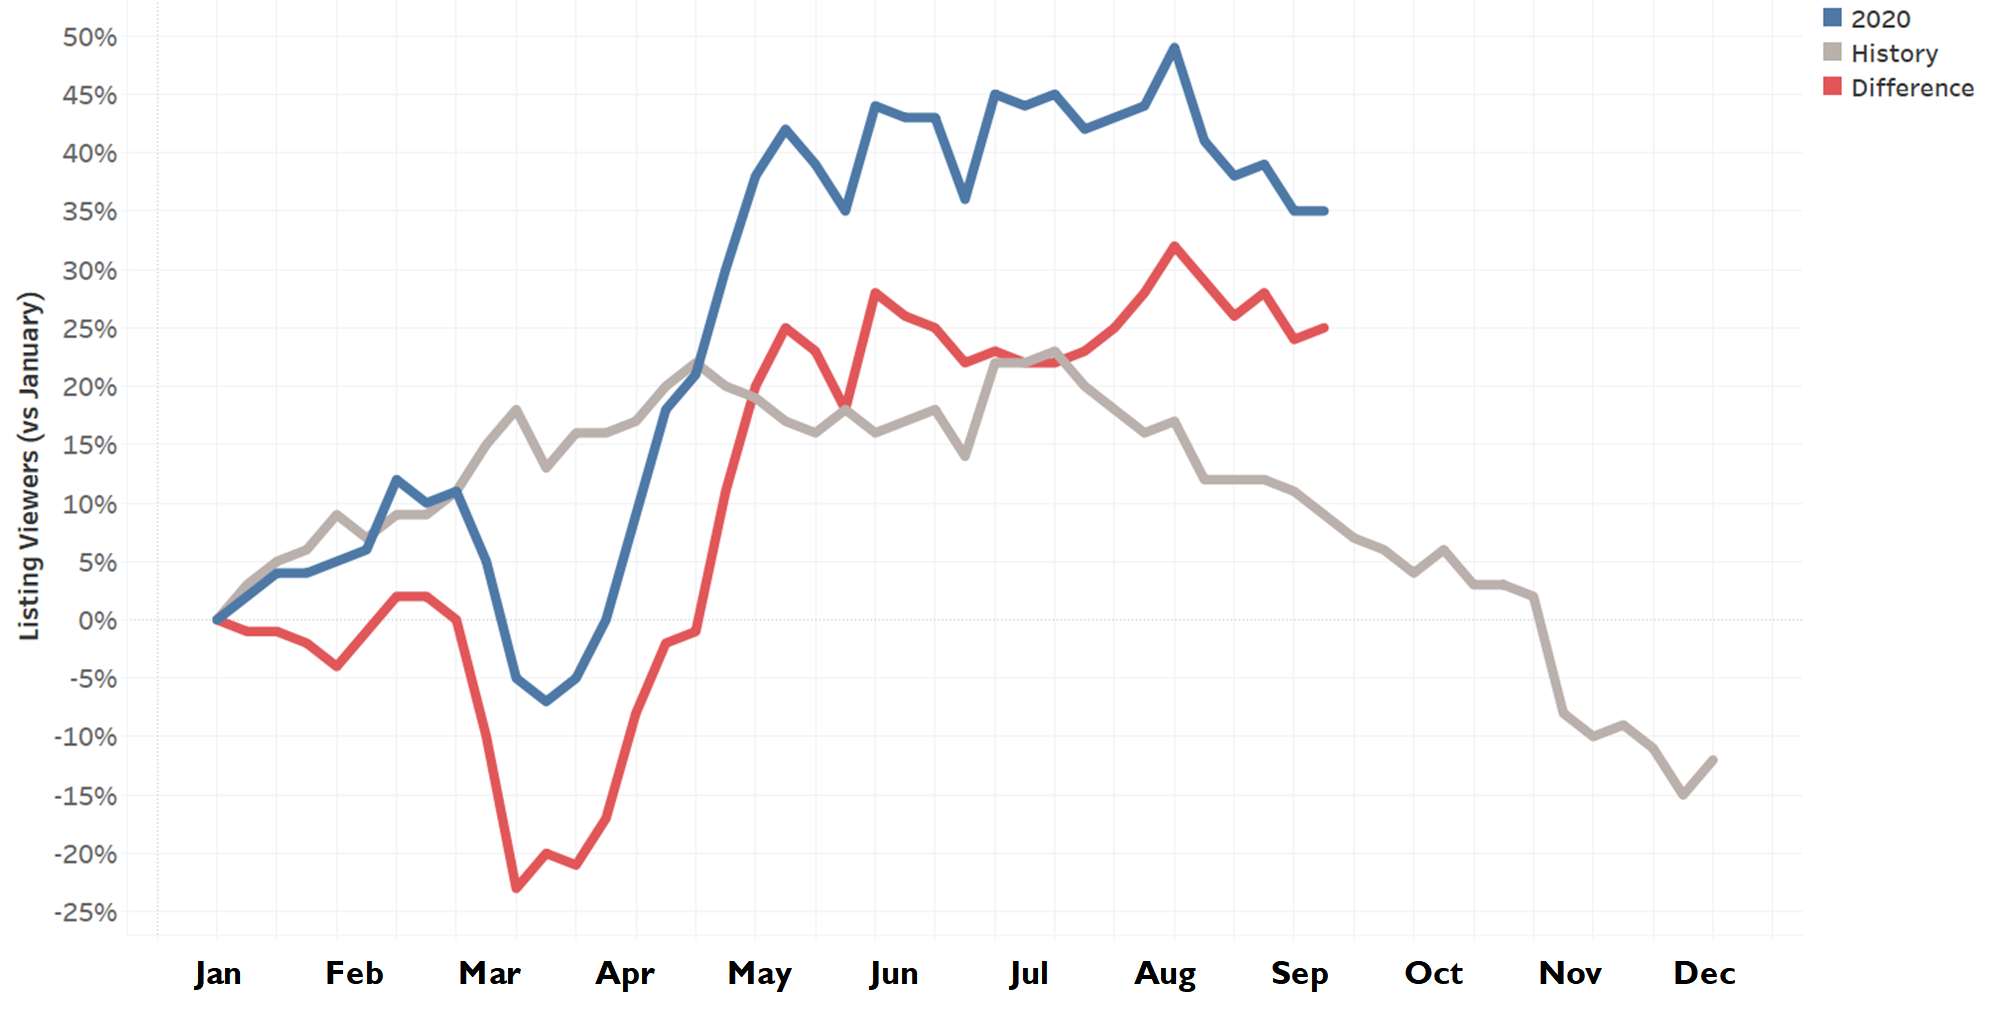
What we expected: By this time of the year, competition (other buyers searching for homes) should be gradually on its way down after peaking earlier in the season.
What we got: Pent up demand, limited supply, and historically-low mortgage rates are keeping buyers in the market. The number of visitors viewing For Sale listings on realtor.com were up 35 percent compared to the start of the year.
The housing market typically slowly ramps up in the first few months of the year and then hits its stride in April as homebuyer hopefuls prepare for a spring or summer purchase. Activity usually remains high until demand eases in August. In 2020, visitor counts were in lockstep with the historical trend until March when the US government declared a national emergency in response to COVID-19. At that point, the 2020 trend diverged dramatically, with visitor counts taking a dip. However, as uncertainty about COVID declined and some areas opened their economies back up, homebuyer demand returned in force as mortgage rates reached historical lows.
By the end of September, we would expect visitor counts to be 9 percent greater than the start of the year, but down 12 percent from the late summer high point. Instead, unique visitor counts are up 35 percent compared to January.
Unique Visitors on realtor.com vs January
What to look for as a new “Best Time to Buy”
So what’s a potential buyer to do with this information? That ultimately depends on individual circumstances and preferences.
Shoppers intent on having more options to choose from should note that active listings typically begin to pick up starting in February. For first-time buyers or others who may not prefer to make a quick decision on a major purchase, note that time on market usually begins to drop rapidly in mid-February, so buying before then may be optimal. With both mortgage rates and the number of homes available for sale expected to remain relatively low, home prices are likely to continue to increase, thus those hoping to get the most bang for their housing buck should consider trying to make a purchase before mid-January, when home prices typically begin a quick ramp up in a normal year. Those seeking to avoid having to compete with many others, should also set their sights on purchasing before early in 2021. Buyers seeking to maximize across these different pressures who have the flexibility may prefer to wait until next September to make their move, but as 2020 has shown us, historical norms can be upended by the unexpected. Still, our expectation is that 2021 will be much closer to normal than 2020.
Methodology
Weekly housing metrics were compared to the second week of the year as a baseline. Historical housing metrics were based on averaged listing data from 2017-2019. Historical visitors data was from 2018-2019.
Subscribe to our mailing list to receive regular updates and notifications on the latest data and research.